
How I Put a Rocket Engine
into Python
Porting ClickHouse for High-Performance Apps
Auxten Wang · Technical Director @ ClickHouse
PythonAsia 2026 · 30 min
Quick Poll
Who has used Pandas?
Who has waited more than 10 seconds
for a Pandas operation?
What if I told you it could be
247x faster?

Auxten Wang
@auxten · auxten.com
- Technical Director @ ClickHouse
- Creator of chDB — acquired by ClickHouse in 2024
- Ex-Principal Engineer @ Shopee
- Cofounder & CTO, CovenantSQL
- Baidu · Qihoo 360 · 4Paradigm
You Love Pandas. But...
- Single-threaded. One core out of 16 doing the work.
- Eager execution. Every step materializes the full result in memory.
- Memory hungry. A 50M-row JOIN needs 10.5 GB peak RAM in Pandas.
On an 8GB laptop, that JOIN will OOM and kill your process.
What if you could run the same Pandas code, up to 247x faster, using 3-23x less memory?
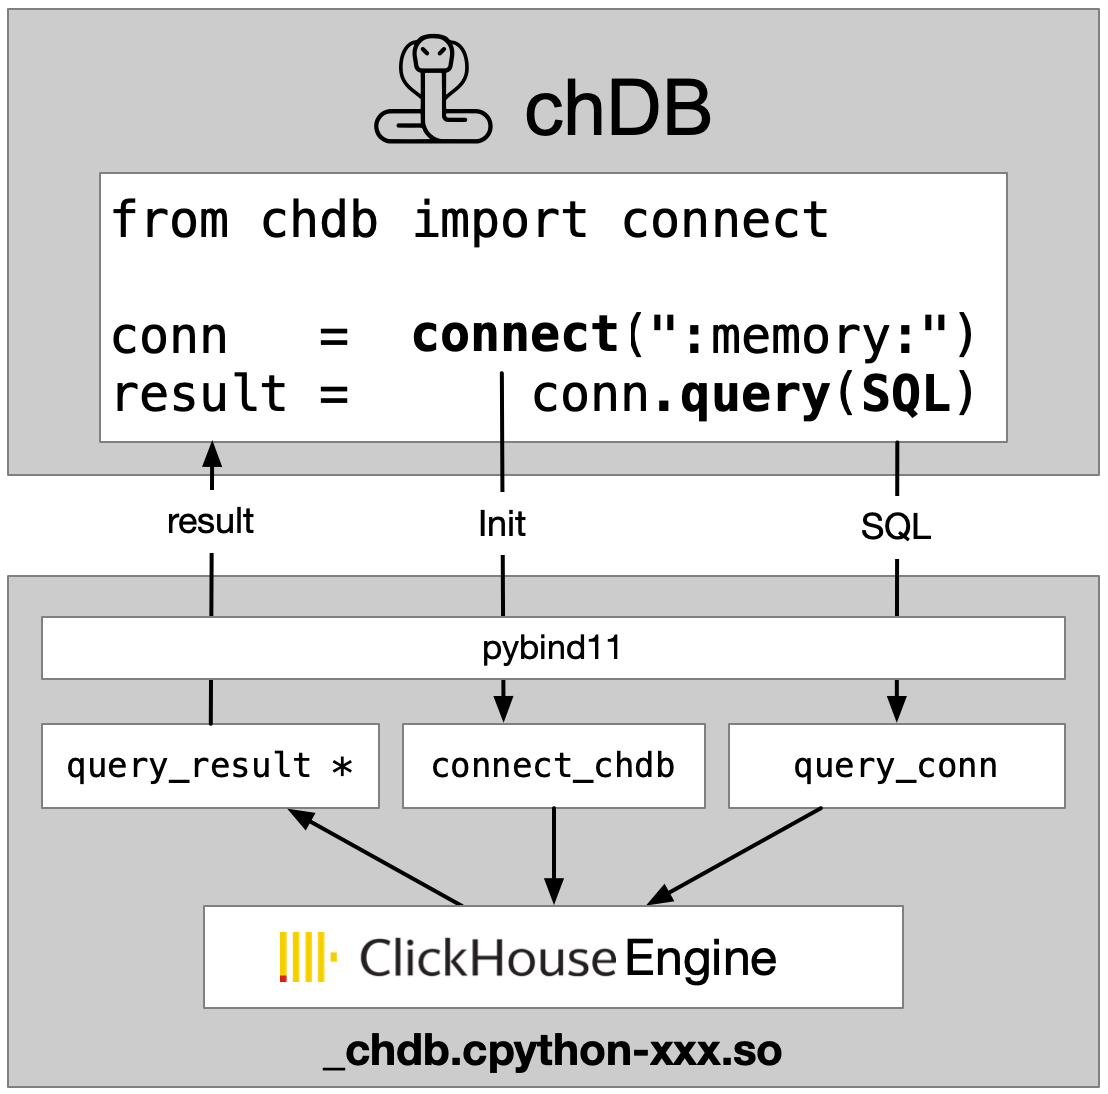
chDB: Rocket Engine on a Bicycle
- In-process SQL OLAP engine powered by ClickHouse
- No server. No config. Just
pip install chdb - Full ClickHouse SQL — 300+ functions, JOINs, CTEs, window functions
- 80+ data formats — CSV, Parquet, JSON, S3, HTTP, PostgreSQL...
- Zero-copy DataFrame ↔ ClickHouse — no serialization overhead
Think of it as: SQLite for analytics — but 100x faster.
How Fast? ClickBench Says...
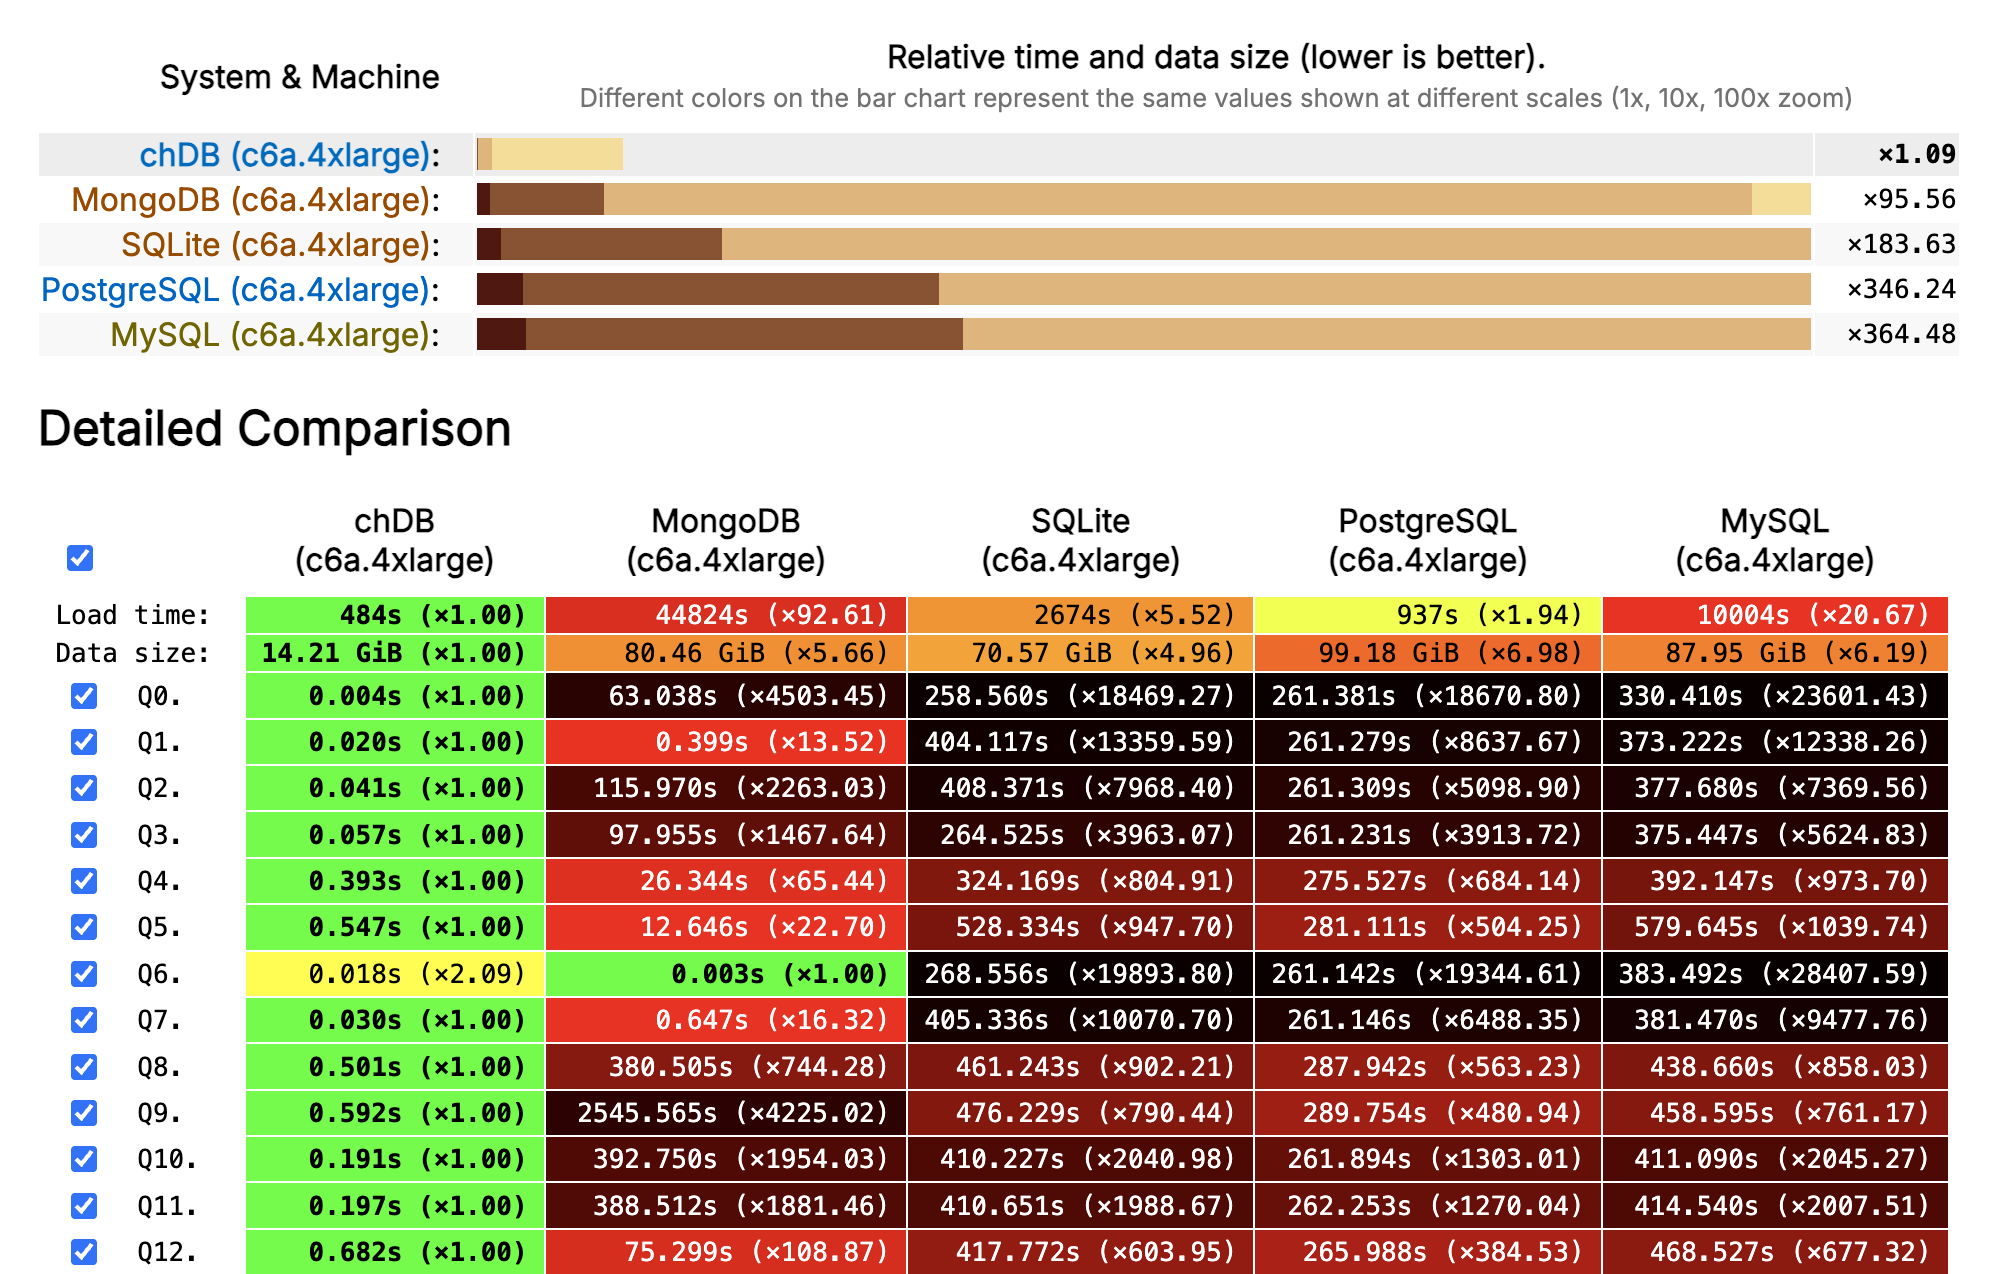
ClickBench · 100M rows of web analytics · AWS c6a.4xlarge (16 vCPU, 32 GB) · Combined score across 43 queries
Hello, chDB v4
import chdb.datastore as pd  # one line change!

df = pd.DataFrame({
    'user_id': range(1_000_000),
    'category': ['A', 'B', 'C'] * 333334,
    'value': [i * 0.1 for i in range(1_000_000)]
})

# Same Pandas API — ClickHouse engine underneath
result = (
    df.groupby('category')
    .agg({'value': ['count', 'mean']})
    .sort_values(('value', 'count'), ascending=False)
)

print(result)  # Triggers lazy execution
Pandas syntax. ClickHouse speed. Zero setup.
Everything is a Table
# Local files
chdb.query("SELECT * FROM file('data.parquet', Parquet)")
chdb.query("SELECT * FROM file('data.csv', CSVWithNames)")

# Remote data
chdb.query("SELECT * FROM url('https://example.com/data.json')")
chdb.query("SELECT * FROM s3('s3://bucket/data.parquet')")

# Python objects — dict, DataFrame, PyArrow
data = {'a': [1, 2, 3], 'b': ['x', 'y', 'z']}
chdb.query("SELECT * FROM Python(data)")

# Databases
chdb.query("SELECT * FROM postgresql('host', 'db', 'table', 'user', 'pw')")
80+ formats. Local, remote, in-memory. Same SQL.
Join Anything with SQL
Three data sources, one query. No ETL.
DataStore: Pandas API, ClickHouse Engine
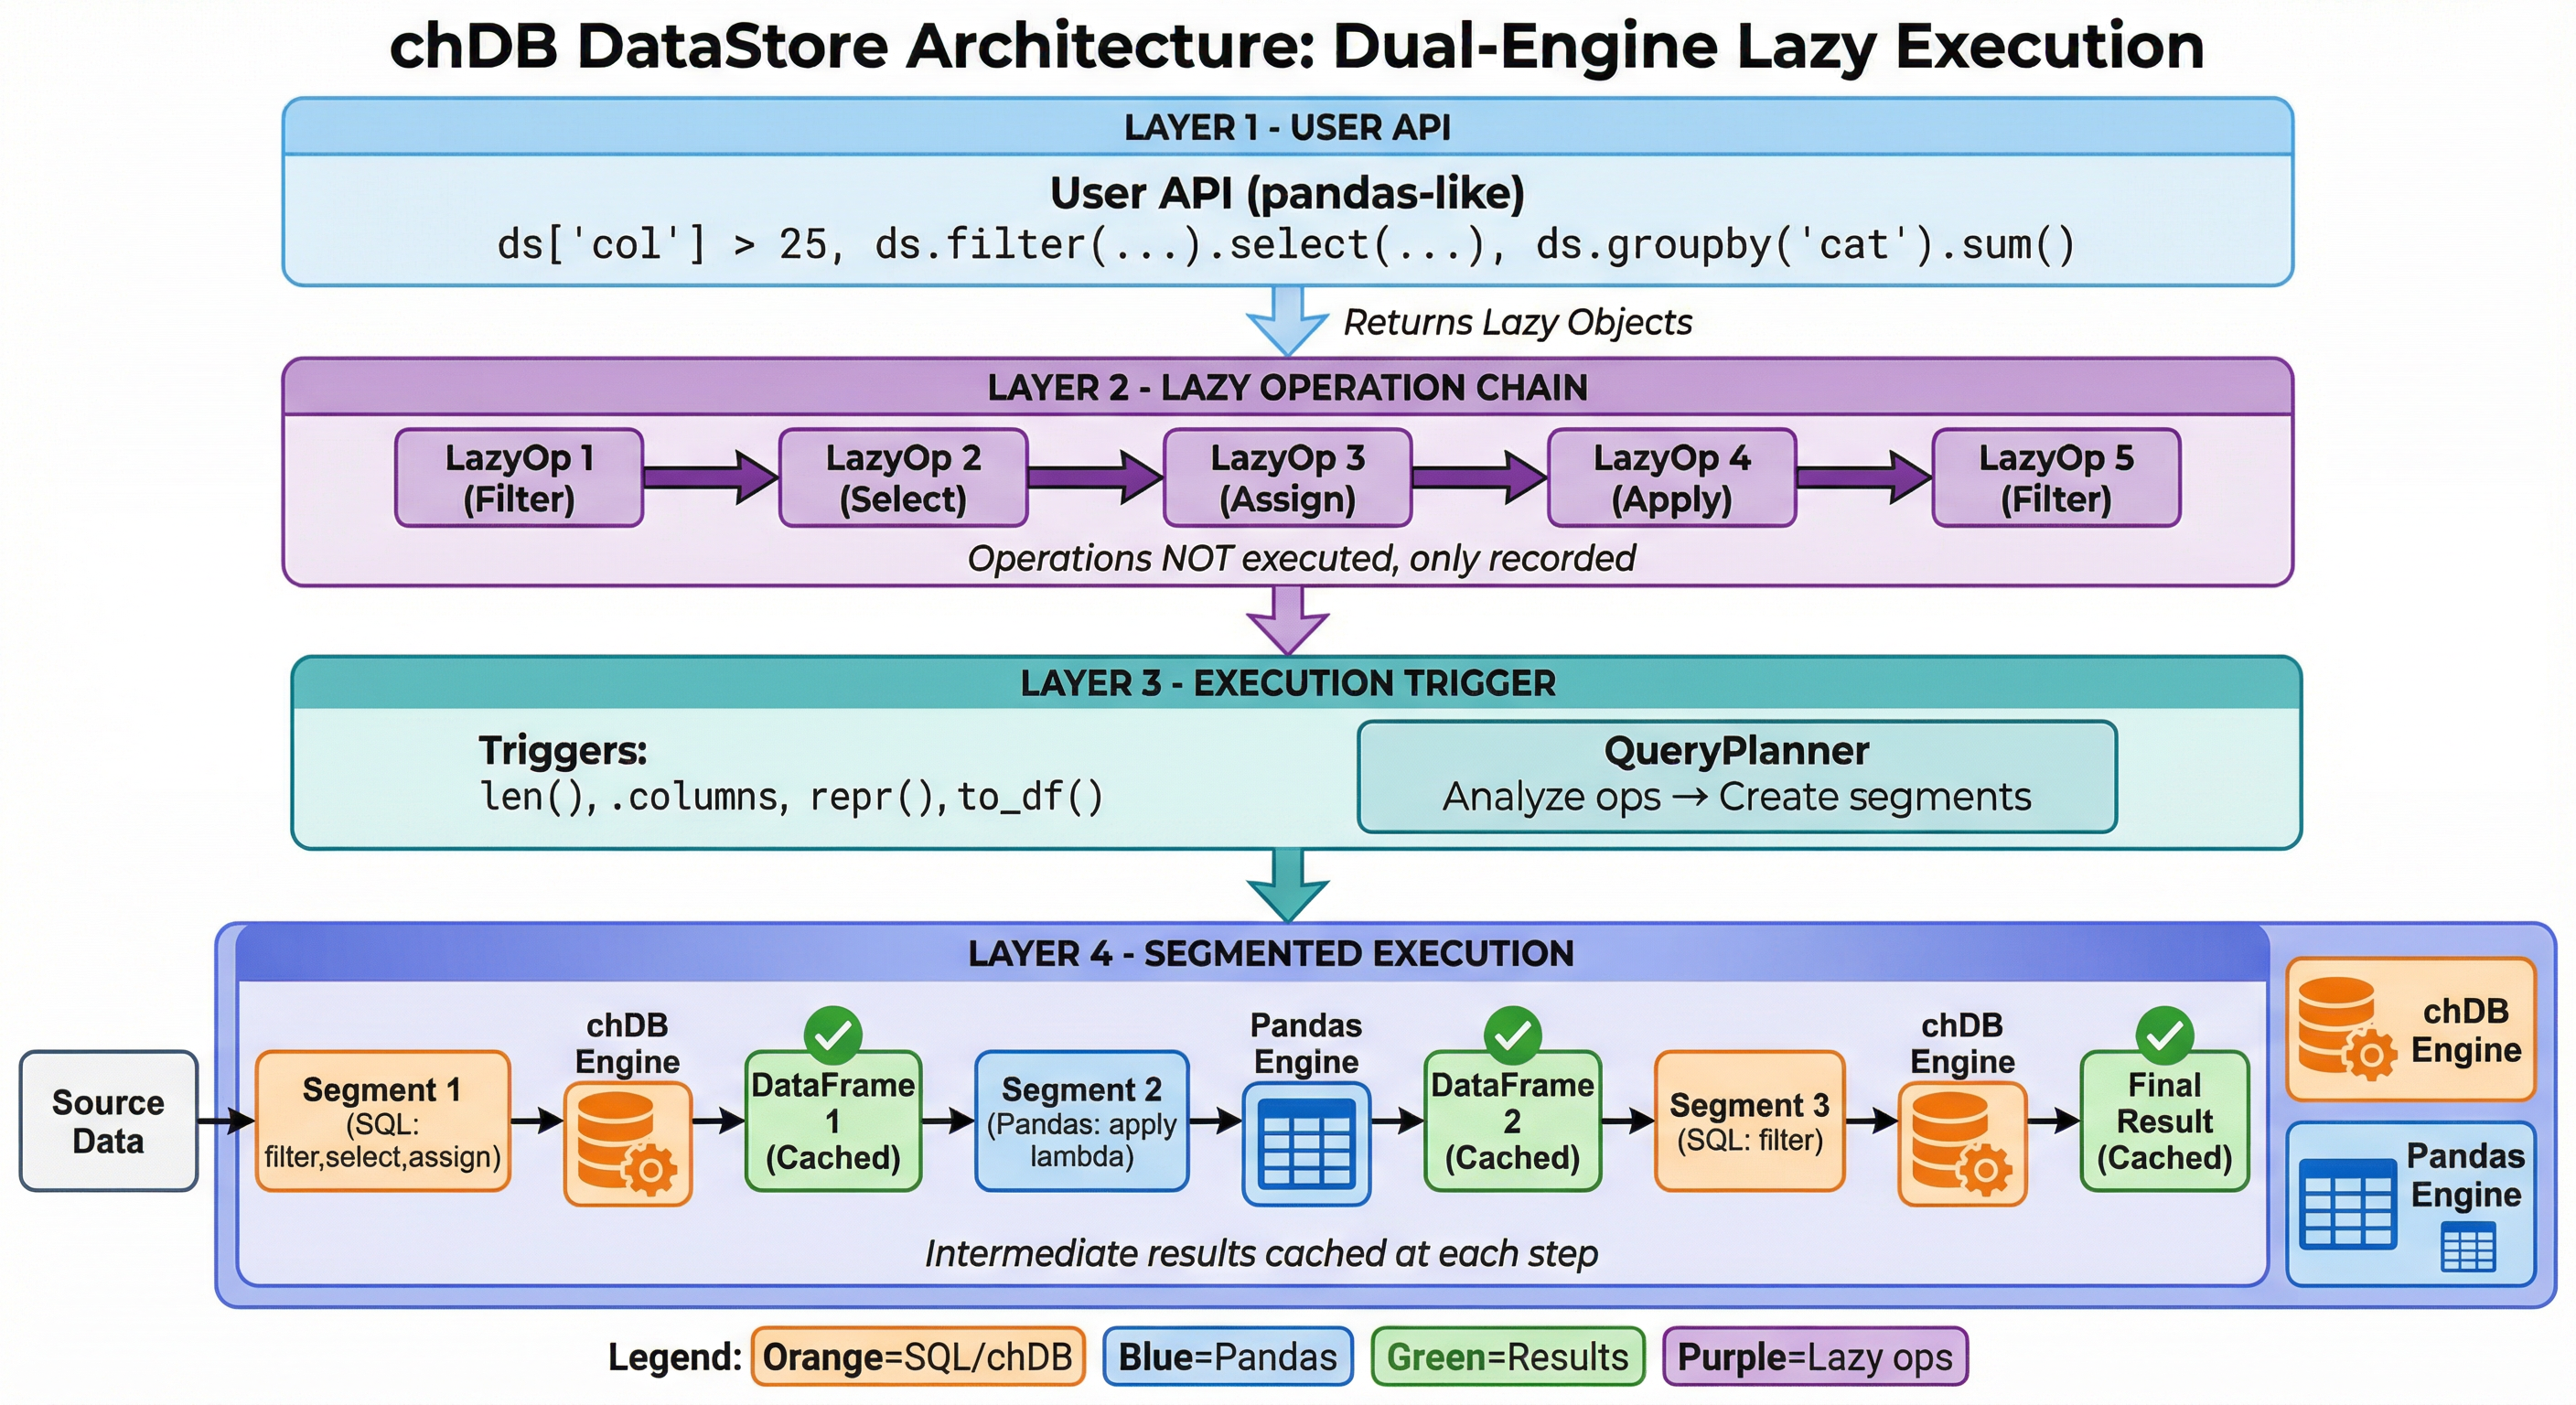
Lazy evaluation · Smart engine selection · Intermediate caching
Your Pandas Code
One Line Change
Under the Hood
Inside the Engine
SELECT city,
       AVG(salary) AS mean,
       SUM(salary) AS sum,
       COUNT(salary) AS count
FROM file('employee_data.csv',
          'CSVWithNames')
WHERE age > 25
  AND salary > 50000
GROUP BY city
ORDER BY mean DESC
LIMIT 10
Segment Execution
What if your pipeline mixes SQL-optimizable ops and Python-only ops?
ClickHouse
filter + group by
Pandas
custom Python func
ClickHouse
sort + limit
- Auto-splits the pipeline at Pandas/SQL boundaries
- ClickHouse handles what it can, Pandas handles the rest
- Seamless handoff via Python's buffer protocol — minimal overhead
You write Pandas. The engine decides what runs where.
Multi-Source with DataStore
import chdb.datastore as ds

# Connect multiple sources
sales = ds.read_csv("local_sales.csv")
customers = ds.DataStore("clickhouse",
                         host="localhost", table="customer_info")

# Join and analyze — lazy, cross-source
result = (
    sales
    .merge(customers, on="customer_id")
    .query("purchase_date >= '2025-01-01'")
    .groupby("city")
    .agg({"revenue": "sum", "order_id": "count"})
    .sort_values("revenue", ascending=False)
    .head(20)
)

print(result)  # Execution triggers here!
Local CSV + remote ClickHouse. One Pandas-style pipeline.
Not Just Python
chDB runs as a native library in 9 languages:
Runs everywhere — no server, no infra:
Benchmark: Speed (50M rows)
| Scenario | Pandas | chDB | Speedup |
|---|---|---|---|
| T01 Read Parquet + COUNT | 2.07s | 0.28s | 7.4x |
| T02 Filter + GroupBy + SUM | 2.88s | 0.69s | 4.1x |
| T03 Multi-key GroupBy + 4 aggs | 5.31s | 1.88s | 2.8x |
| T04 JOIN (50M × 10K) + agg | 6.76s | 0.87s | 7.7x |
| T05 Top-10 per group (window) | 35.05s | 9.29s | 3.8x |
| T06 P95 quantile by region | 4.14s | 0.68s | 6.1x |
| T07 Derived cols + filter + Top-1000 | 2.93s | 1.14s | 2.6x |
| T08 Count Distinct (exact) | 7.57s | 1.38s | 5.5x |
| T09 In-memory DataFrame query | 2.89s | 2.17s | 1.3x |
| T10 Time-series monthly agg | 4.07s | 0.68s | 6.0x |
chdb v4.1.6 vs pandas 3.0.1 · Ubuntu, 16 CPUs, 33GB RAM, Python 3.14 · chDB wins 10/10, mean 4.2x
Benchmark: Peak Memory (50M rows)
Peak RSS via Linux VmHWM (kernel-level, unfakeable) · Geomean memory saving: 2.9x
On Your 8GB Laptop
| 50M-row Operation | Pandas Peak | chDB Peak | 8GB Laptop |
|---|---|---|---|
| JOIN + aggregation | 10.5 GB | 1.8 GB | Pandas OOM · chDB OK |
| Derived columns + filter | 7.4 GB | 3.0 GB | Pandas OOM · chDB OK |
| Multi-key GroupBy | 7.3 GB | 4.2 GB | Pandas OOM · chDB OK |
When Pandas OOMs, the OS kills your process — no recovery.
When chDB hits a limit, it throws an exception you can catch.
AI Writes Pandas. chDB Runs It Fast.
- LLMs generate excellent Pandas code — it's the most common data API in training data
- DataStore executes it on ClickHouse automatically
- No need to teach your AI a new API
The future workflow:
AI writes Pandas → chDB makes it fast
"Hey Claude, group sales by region and show me the top 10."
↓ generates standard Pandas code ↓
↓ runs on ClickHouse via DataStore ↓
↓ up to 247x faster, 3-23x less memory ↓
The Numbers
COUNT(*) on 1M row DataFrame
exporting 1M rows to DataFrame (2.64s vs 3.47s)
50M-row JOIN+agg
vs Pandas
supported
DataStore
Getting Started — 30 Seconds
pip install "chdb>=4.0.0"
import chdb.datastore as pd  # swap one import, done

# Your existing workflow — unchanged
df = pd.read_csv("your_data.csv")

result = (
    df[df['amount'] > 100]
    .groupby('category')
    .agg({'amount': 'sum', 'order_id': 'count'})
    .sort_values('amount', ascending=False)
    .head(10)
)

result.plot(kind='bar')  # Still a real DataFrame
No server. No config. No new API to learn.
The Road Ahead
-
Python 3.14 free-threading — no more GIL
Register Python functions as ClickHouse UDFs in vectorized pipelines -
PyTorch DataLoader integration
Efficient batching, shuffling, and streaming for ML training -
Hybrid execution
Seamlessly scale from laptop to ClickHouse Cloud -
Multi-modal data processing
Text + image + audio pipelines with chDB as the data backbone
Thank You!
- GitHub: github.com/chdb-io/chdb
- Docs: clickhouse.com/docs/chdb
- PyPI: pypi.org/project/chdb
- Discord: discord.gg/D2Daa2fM5K